Reports
Reports is a single hub for every export-ready view of your data — revenue, invoices, pipeline, projects, payouts, and more, organized by category instead of scattered across each module.
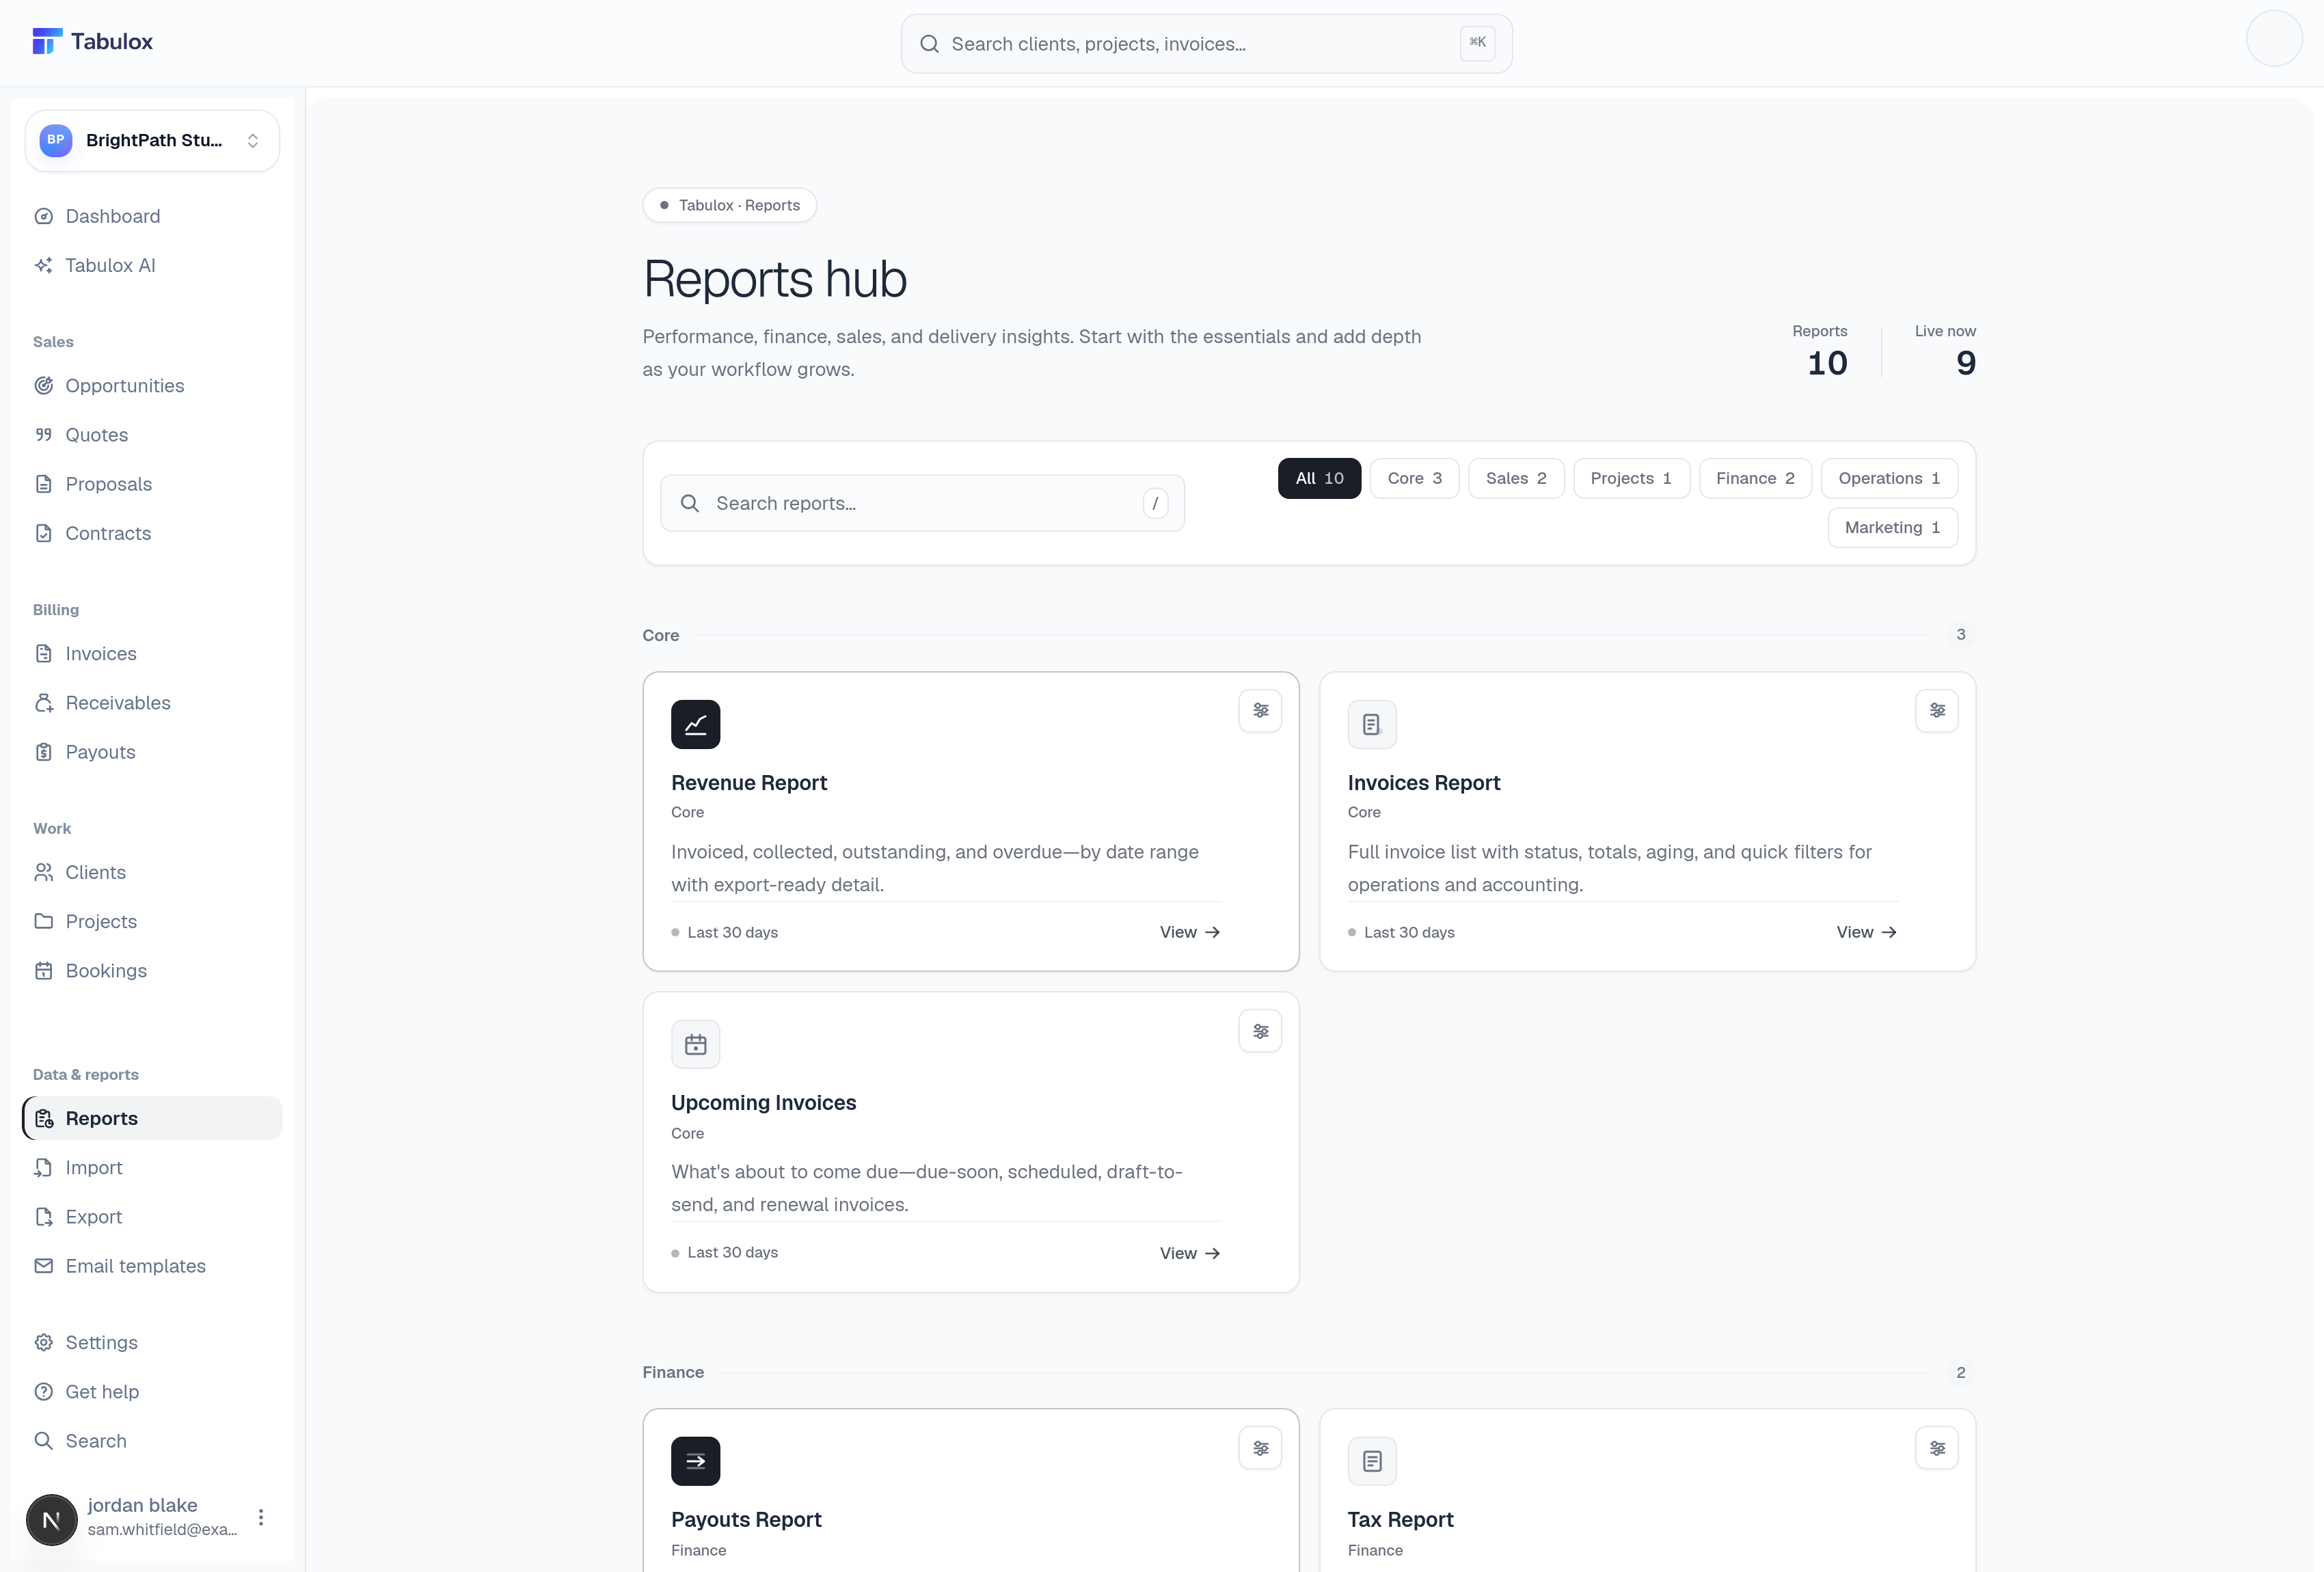
Browsing reports
The category pills across the top (Core, Sales, Projects, Finance, Operations, Marketing) filter the grid, and the search box finds a report by name if you know what you're after. The counts next to Reports and Live now at the top right tell you how many exist versus how many are actually built — new report types show up here as "Coming soon" cards before they ship.
The reports
- Revenue Report (Core)
Invoiced, collected, outstanding, and overdue totals by date range, with export-ready detail. This is the deepest financial view — start here for "how are we actually doing" questions.
- Invoices Report (Core)
The full invoice list with status, totals, aging, and quick filters — built for operations and accounting work, like Invoices but reshaped for exporting and filtering rather than day-to-day action.
- Upcoming Invoices (Core)
What's about to come due: due-soon, scheduled, draft-to-send, and renewal invoices in one list.
- Payouts Report (Finance)
A reportable view of what's moved from Stripe to your bank — the historical companion to the live Payouts page.
- Tax Report (Finance)
Collected and owed tax figures for a given period.
- Quotes Report (Sales)
Every quote with status and value, for tracking win rate and pipeline velocity from the Quotes side.
- Opportunities Pipeline (Sales)
A reportable rollup of Opportunities — stage, value, and age, without the day-to-day triage UI.
- Project Report (Projects)
Delivery status across every Project — useful for a portfolio-level check rather than one project at a time.
- Inquiry Report (Operations)
Volume and outcomes for inbound inquiries over time.
Lead Sources (Marketing) is listed but marked "Coming soon" — it isn't built yet, and clicking it won't do anything useful until it ships.
Using a report
Click View on any card to open it. Most reports share the same shape: a date-range control, one or more filters specific to that report, a data table, and an export action for pulling the numbers into a spreadsheet.